
Another repost from The Whiteboard
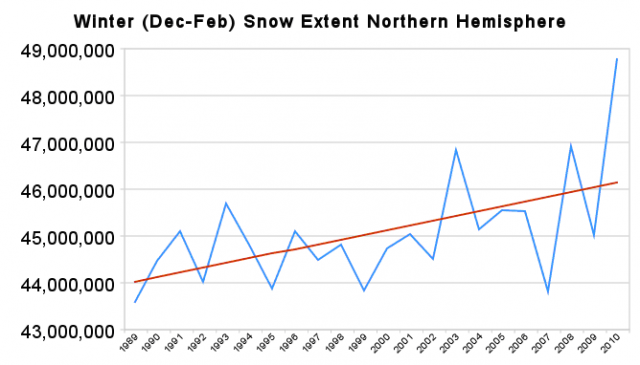 Two years ago, Steven Goddard presented the WUWT crowd with multiple analysis of Northern Hemisphere Winter snow cover. In one entitled “North American snow models miss the mark – observed trend opposite of the predictions”, Goddard used data from Rutger’s Global Snow Lab to claim that the 22-year trend beginning in 1989 for Winter (Dec, Jan, Feb) in the Northern Hemisphere invalidates the CMIP3 modeling of snow extent as presented by Frei and Gong in 2005 in their paper “Decadal to Century Scale Trends in North American Snow Extent in Coupled Atmosphere-Ocean General Circulation Models”. This paper is summarized at a Columbia University web page Will Climate Change Affect Snow Cover Over North America?. How has Goddard’s analysis held up? Did the decreasing snow trend he describe hold over time? My original response was here: Steve Goddard’s Snowjob. It was one of my first posts and I though it would be fun to revisit it.
One flaw in Goddard’s analysis is that he used Northern Hemisphere D-J-F snow extents to compare with the paper’s analysis of North American January extent. A larger flaw was his cherry pick of 1989 to begin his trend analysis. Since this was purportedly a critique of the model trends presented in the paper, let us turn back to the NA January data for this analysis.
Below is the Rutger North American January snow extent expressed as a fractional value of North America surface area. The points in red are for the same years as those used by Goddard in his NH Winter trend analysis. The points in blue are those discarded by Goddard. The blue trend includes all data points through 1989. The red is 1989-2010. The outlying lines are the 2xsd of the trend. The points in purple are the new data points added since the original analysis.
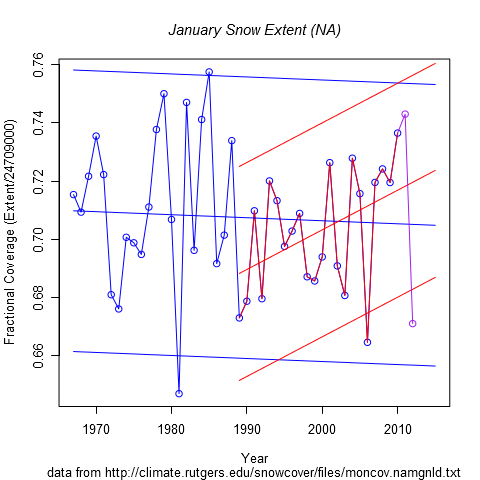
I have become more aware of the confounding factor of autocorrelation when computing confidence intervals. A quick check of lagged correlation does not show any strong correlation – maybe a weak negative correlation.
1 yr: 0.005
2 yr: -0.21
3 yr: -0.20
4 yr: -0.21
No comments:
Post a Comment