
A repost from The Whiteboard.
Introduction
A While back (2010 to be exact), Steve Goddard posted a series of threads on WUWT on Northern Hemisphere snow cover extent. (see here and here and here and here.) In one entitled North American snow models miss the mark – observed trend opposite of the predictions, Goddard uses data from Rutger’s Global Snow Lab to claim that the latest 22-year trend for Winter (Dec, Jan, Feb) in the Northern Hemisphere invalidates the CMIP3 modeling of snow extent as presented by Frei and Gong in 2005 in their paper Decadal to Century Scale Trends in North American Snow Extent in Coupled Atmosphere-Ocean General Circulation Models. This paper is summarized at a Columbia University web page Will Climate Change Affect Snow Cover Over North America?
Discussion
One immediately obvious problem in Goddard’s comparison is that he is showing snow extent for the Winter (Dec, Jan, Feb) in the Northern Hemisphere while the charts shown for the paper (and linked by Goddard) are January snow extent in North America. There is no reason for this apple-to-oranges comparison since the Rutger’s data is available for January North America. Although it is worth noting that Frei and Gong report a similar response across all months.
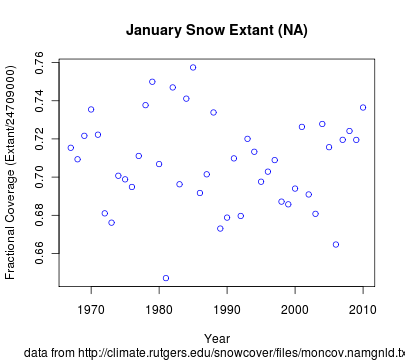
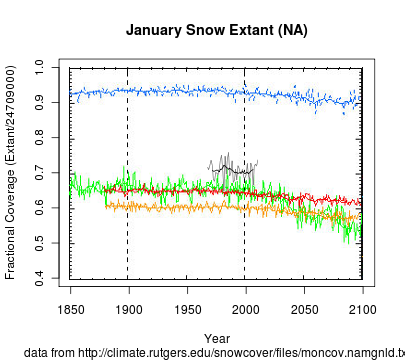
This is the January snow extent for North America for the full range available in the Rutgers GSL data set.
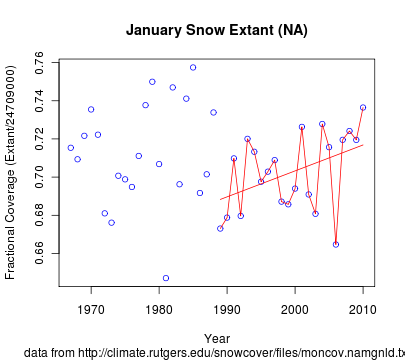
Goddard selected the last 22 years (Winter, NH) to demonstrate an increasing trend. No reason is given for that particular data range, although to the casual observer it appears it was chosen to maximize the observed trend. Here we select the same 22 years in Jan NA.
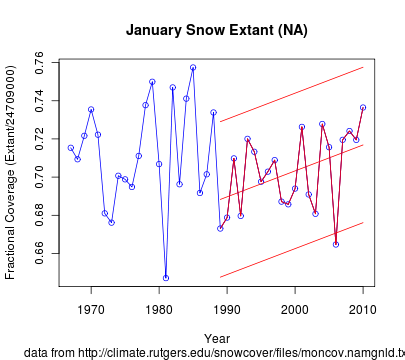
Goddard provides no discussion of the statistical significance of the trends, claiming that such treatment is irrelevant in analyzing observations of historical, physical data. Here I have included a two-standard-deviation box around the 22 year trend for Jan NA.
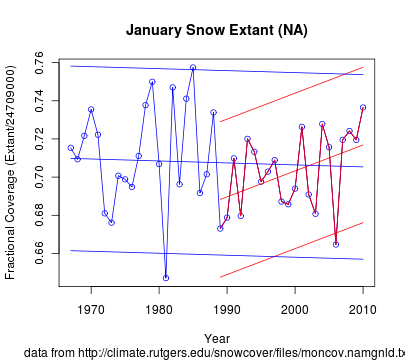
Here I have included a trend and 2-sigma envelope for the whole 44-year data set.
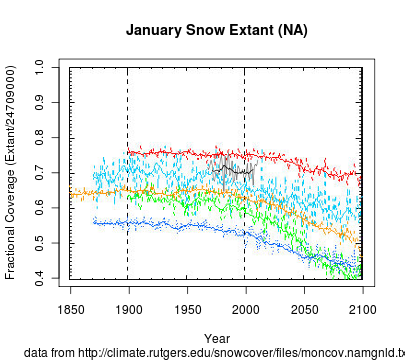
The data set that Goddard seeks to compare the historical data with is derived from nine models included in the CMIP3 models as run for IPCC AR4. Nine models are displayed with an obviously wide-ranging set of values for the actual snow cover extent. But Frei and Gong show that all nine sets predict decreasing SCE trends in the 21st Century. Here I use an image processor (GIMP) to overlay the historical data. The historical data is in gray with a 9 year 2-sided running average (per Frei and Gong) in black.
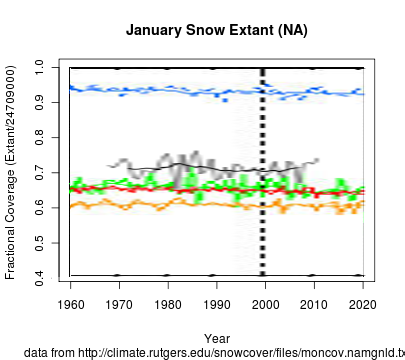
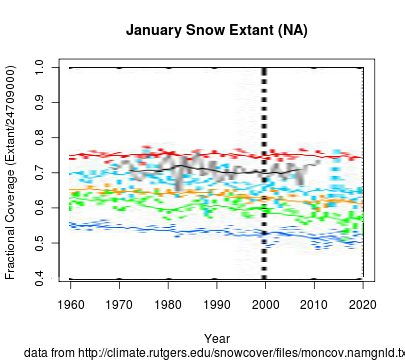
Here I zoom into the data range from 1960-2020 to better display the current data.
Comments
If it stood alone, the 2.15 t-value for the 22-year trend would demonstrate statistical significance. But it does not stand alone and Tamino at Open Mind demonstrates that when you cherry-pick the trend with the greatest t-value out of a 44 point data set, you need a t-value of 3.75 to achieve statistical significance.
Simply eyeballing the historical trend in the overlays is insufficient to invalidate the predicted trends. Nevertheless, with the actual modeling data, some progress might be made in measuring the skill of the models in the opening decade of the 21st Century. I have requested access to the original CMIP3 data for this purpose.
This is repost of an original two years old. Just a week or two ago, I updated the snow extent with data from January 2011 and 2012.
ReplyDeleteGoddard's Snowjob Revisited
http://rhinohide.wordpress.com/2012/02/23/goddards-snowjob-revisited/
Have you heard that Steve Goddard is one of Joe Bastardi's heroes? lmao
ReplyDelete