Northern Hemisphere’s shifting curve.

Steve Goddard and others are having a hard time deflecting attention from climate change with the weather extremes that are occurring around the world this year and people are starting to notice. They have been scouring the records to find a headline to mislead with. Here is an example for the Orwellian 'Real Science'; 'US Summers Getting Cooler Since 1895', and it even comes with a graph to prove it;

This certainly indicates a decline in the summer temps shown so how can there be more climate extremes now? The answer is in the graphs title, 'Summer Maximum Temperatures' and I was going to do a long post on it but when I found it has been explained rather well over at 'uknowispeaksense', I thought plagiarism is so much easier than origionality so I will let them take up the story;

I’ve already had one commenter in here point out a bunch of cherrypicked individual high temperature records from all sorts of places and from different times and asking me how there can be new extremes as reported by James Hansen if these records haven’t been broken. Of course Hansen’s data is dealing in average temperatures not indivdual records. As the average temperatures increase the bell curve shifts to the right indicating that on average, extreme highs will increase and extreme lows decrease. Without bothering to check the credibility of the data that suggests that in Seville, Spain on August 4, 1881 it was 122 degrees F, and assuming it is correct, my question is, so what? We are not dealing with individual time points here, we are dealing with decadal averages. That said, here’s the thing, average global temperatures are rising. That fact is indisputable. That also means maximum temperature anomalies and outliers will continue to be superceded. It is inevitable. Continuing to try and muddy the waters with erroneous outliers just demonstrates how desperate deniers are to hang on to their evermore untenable positions. It is sad.

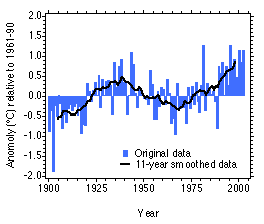
Here is a page with some excellent graphics. The first, showing the increasing number of “hot” and “very hot” summers in the northern hemisphere and the second, the graphic highlighting the shift to the right.
http://www.nasa.gov/topics/earth/features/warming-links.html


Suyts Fails To Touch Base

It seems that either my criticisms at suyts place or my last post pointing out that his claim about Arctic temperatures in the thirties compared to today used temperatures over a decade out of date embarrassed him enough to do a further post where he actually tried to get some current temps to compare the thirties with. He even dedicated the post to me! - Now there is someone who is easy to awe. He even got off to a good start by choosing UAH satellite data.

Unfortunately he made another totally embarrassing hash of his analysis. His commentators even congraulated and fawned over it and one even re-blogged it, so it doesn't bode well for their critical thinking skills. To be honest it was doomed from the start because suyts already had the answer he wanted so it didn't really matter what the data showed, he was always going to get the answer he needed.

The technique he chose involved 'splicing' the UHA data to the Cosimo graph mentioned in the last post. This is not necessarily a bad thing if done correctly but like so many AGW deniers he says it shouldn't be done. Adding data sets from different sources in appropriate in a Meta Analysis is common across all science disciplines. It is especially common in climatology, and the likes of Prof Mann has done it, so if deniers can convince themselves it shouldn't be done at all it allows them to dismiss at least some of the science showing how wrong their thinking is.

So suyts makes it clear that he doesn't like 'splicing'. In fact he makes the point several times but then does it anyway and uses his results as evidence he was right all along. That's right - he uses a technique he believes is invalid to get a result that proves his case and makes a post about it. The irony of the contradiction seems lost on his commentators but wouldn't be on anyone with the slightest sense of true skeptcism.

So by all rights this post should end here with another embarasment to suyts.

~~~~~~~~~~~~~~~~~~~~~~~~~~~~~~~~~~~~~~~~~~~~~~~~~~~~~~~~~~~~~~~~~~

However 'splicing' is a valid thing to do so maybe even if suyts doesn't like it he still has made a valid point - if only:


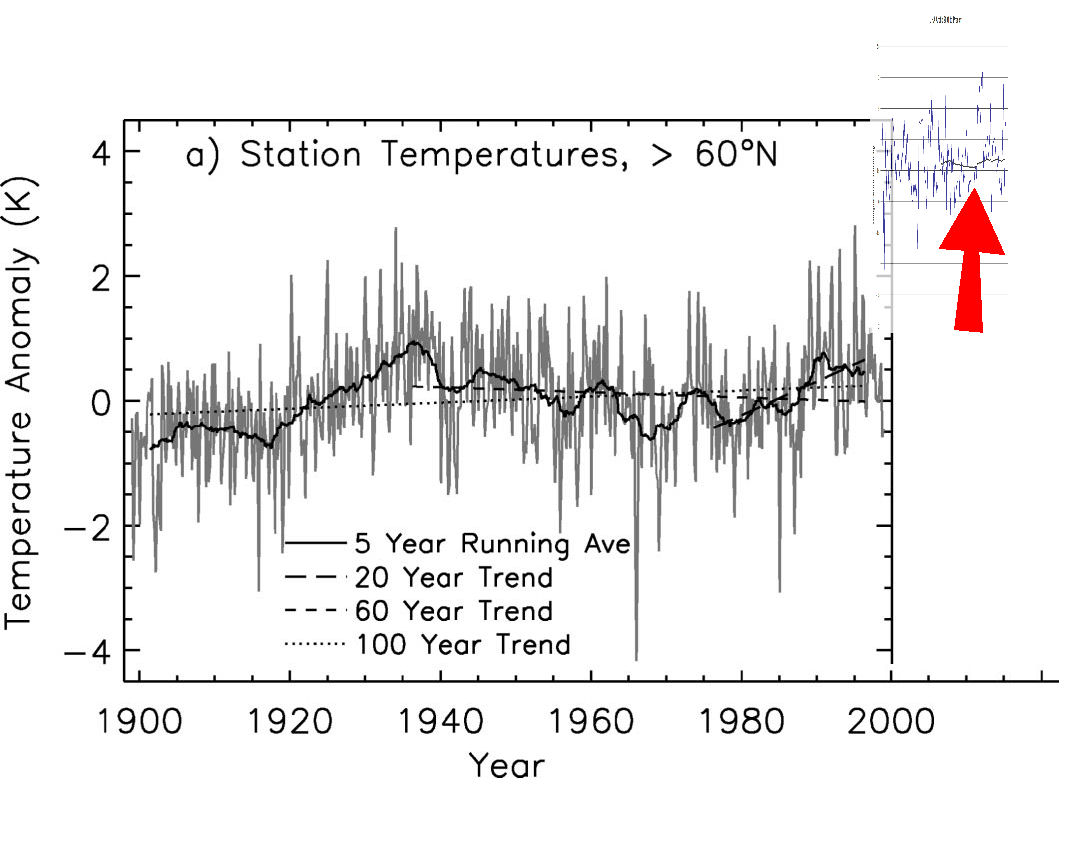
He first graphs the last decade of the UHA data set with a trend and a 60 month moving average and gets this;


Then he sticks aligns 'the anomaly axis to match Cosimo’s' graph that he used in his first failed post and gets this;

I suppose because the black smear, (highlighted by my red arrow), is below the 'thick black line' he added then he believes that the current 5 year average is below that of the 1930s and claims 'that the arctic, after adding the recent arctic temps, is still colder than what it was in the late 1930s'


Oh Dear!

Combining data sets, when done appropriately, is valid. If you don't understand why then consdier this; If various samples; ice cores, tree rings, lake sediments etc., when tested are known to contain different values related to temperature, then how can you can you determine what those temperatures are unless you align the values with known and reliable temperatures for at least part of the record? So these proxy temperature records are aligned with known temperatures, usually the most accurate instrument record for the same area the proxies are taken from, to determine temperatures back in that record when temperatures are known with less certainty. So if it is valid to calculate proxy temperatures using this method how can it be invalid to add (splice) the most accurate temperatures to the record? This is really all that Prof Manns 'Nature Trick' amounted to - he added the most accurate instrument record to over write and extend the proxy record and had it documented in research published in Nature magazine.

What suyts had done is not the same technique, even if he believes it is. You just can't take different data sets and align 'the anomaly axis' to zero. This shows such ignorance of the basics it is difficult to believe that he not only did it but his, (now apparently just as ignorant), commentators didn't call him out on it.

Different data sets have different base lines!

The Cosimo graph appears to use data with a 1961-1990 (HadCru) base line. The UHA satellite data has a 1979-1999 base line - this data set didn't start until the December 1978. Of course the 5 year trend of the UHA is going to be below! The only way to do the 'splicing' properly is to average the same time period for all data sets used - something I'm not prepared to spend time on as there is plenty of current research showing recent Arctic temperatures are unprecedented in several centuries. But I thought I would do a rough calculation on the differences in the base lines and reapply suyts technique to see what he would have got if he had knowing anything about science. 

Using this link I got the data for the major temperature data sets and worked out the average of HadCru between 1979 - 1999 and also for the UHA data for the same period. I found HadCru = -0.03742 and UHA = -0.0933, so a difference or the offset is 0.055888.

I then plotted the same UHA decade that suyts used in his post to ensure we were both using the same data set in the same way and got this;


The graph looked the same so I rescaled it with the offset and added it to the original Cosimo graph and ended up with this:

As you can see the trend is well above the 1930s level. I know this technique is not very accurate in either calculating the offset nor the alignment so just to check that it wasn't a totally inaccurate depiction I looked for a graph showing past to current Arctic temperature trends and found this from the Alaska Satellite Facility;


It has an 11 year rather than a 5 avg year but it still clearly shows the peak in the 1930s and it even more clearly shows it was not as warm as current temperatures.

So how did suyts do?

Other than using a technique that he believes wont give a valid answer, and displaying little knowledge of some very basic scientific methods, and being totally ignorant of the concept of data sets having a different zero base line for anomalies the boy did rather well! It remains to be seen if he has the honesty and maturity to correct his rather obvious mistakes and perhaps even apologise for misleading his very gullible readers, but based on his example so far and  this latest nonsense  it doesn't bode well so I'm not going to be holding my breath - however time will tell.

Warmer In The Thirties - I think NOT

A regular commenter on the Orwellian named 'Real Science' is someone called suyts who has merited a mention on Really Sciency before for his ‘some pale shading’ and his warped logic achieving 'muppet' status. Well this guy has his own blog which reaches a whole new level of crazy.

Recently the 'syuts place' blog made a very specific claim - "Arctic Was Warmer In The Thirties!!". Yes the two exclaimation marks were his just to show how significant he wanted the claim to be considered. He even included graphs picked out from actual credible sourses to prove it;

"I added the thick black line" appears on the NASA version by suyts.
The actual source for his graph is Warming Trends in the Arctic from Clear Sky Satellite Observations, JOSEFINO C. COMISO, from NASA Goddard Space Flight Center which appeared in Journal of Climate way back in 2003, via NASA's "Evidence of Arctic Warming" page.

It is true that the 'thick black line' shows that the temperature trend was higher in the thirties than it is by the end of the graph. However if you read the paper you find that Comiso and the research fully support the global warming theory - as does NASA. There is no doubt about this and the Abstract clearly states;
The longer-term in situ surface temperature data shows that the 20-yr trend is 8 times larger than the 100-yr trend suggesting a rapid acceleration in the warming that may be associated with the recent change in phase of the Arctic Oscillation that has been linked to increasing greenhouse gases in the atmosphere.
So basically suyts has cherry picked a graph, altered it a little and taking it out of context has added his own denial spin that is totally at odds from the actual published research - a typical tactic when no real research supports your beliefs.

But is there any evidence that the Arctic Was Warmer In The Thirties?

I commented on suyts post to make two specific points;

First, as another poster, uknowispeaksense, (whose rather good blog I have been following for a while), says: "So What?" Cherry picking one area to suggest something significant about Global temperatures is wrong on so many levels. It a tired old tactic. Find an area that might just be bucking the trend for now and highlight it. Then when challenged claim that you were never suggesting it related to anything else. Of course if this were true and the person was honest, this would have been stated from the outset - "This area was warmer in the past than it is today - even though most other areas have warmed more now". This sort of level of openness and honesty is rarely found in those who are desperate to find something to support their beliefs.

So simply put, even if suyts is correct in his statement that the "Arctic Was Warmer In The Thirties", (and he isn't as I will show), without a global context the statement is as significant as saying refrigerators were as warm in the thirties. 

The second point I wanted to make is obvious to anyone with the slightest hint of real scepticism. The graph presented stops over a decade ago. I included a link showing more recent temperatures from NOAA's Arctic Report Card. This is from 2011;

This time the black line has been added by me


It clearly shows that while the peak trend in thirties was high in 2000, where Comiso's data ends, that by 2003 the temperature trend exceeds any in the record. Natural variation still causes the temperature to drop below my line but the overall direction of the trend is clear and with 2012 so far the warmest recorded for the Northern Hemisphere I strongly suspect that trend is likely to continue.

So what response does someone get from suyts for highlighting more recent data that clearly shows that the Arctic was NOT warmer in the thirties?
"I thought it was you guys who put so much stock in “peer-review”."
 I assume that this response is because the NOAA graph is from their report card and suyts graph is cherry picked and  misrepresented from research that is totally at odds from his beliefs.

He also replied;
"warmists, for some reason, don’t like this graph. They aren’t very explicit as to why"
Clearly Language comprehension isn’t his strong suit and the meaning of  “the graphs presented stop over a decade ago” was out side his range of understanding. I then asked him specifically Do you accept that the recent temperature data for the area shows your headline to be false?” His direct answer was No. The graphed data demonstrably shows that he is wrong. His reasoning was bizarre;
"Now, using the same data set as COMISO, show that I’m wrong."
Why would I have to show him wrong? It must be accepted from the data I presented that his headline clearly is wrong. Logic would state it is up to him to present evidence to the contrary, especially since he had presented no recent data to support his recent claim. A bit like stating flared trousers are the height of fashion and proving with a picture from the 1970s.

suyts  - height of fashion?

 As for using the same data that was used in the Comiso paper, that data ended in 2000 but it was data approved by NASA just as the data used in the NOAA graph - except of course that data was more current.

There was of course a lot more rambling but none of it provided any support for the Warmer In The Thirties claim. Undeterred by his irrational nonsense I decided to spell out what would be acceptable evidence
"The NOAA document I have linked shows Arctic up to 2010 and clearly shows a peak about 0.7 kelvin above the 30s peak. By all means show ANY data from a recognised source covering the same area and time frame you prefer if you can find any actually showing the ‘Arctic Was Warmer In The Thirties’."
 It was at this point that he started to believe he was Batman!
Wholly crap Laz! ...  What is implicit throughout the entire post and comments are that none of the present data sets show what was once shown. Notice how your NOAA offering butchers the data?
Ah, so that's it. A conspiracy, the data has been manipulated in nefariousness ways. I actually knew this was coming because in a previous comment I stated I was "not really interested in any conspiracy nonsense" he would concoct. The psychological problem with those that believe in conspiracy theories is that by necessity they do not think them a conspiracy. I'm not suggesting that he is wrong about data adjustments. They are necessary to reduce uncertainties as the science improves. The problem is that the conspiracy theorist will always believe that they have either been altered to prove them wrong or not altered, (in the case of not compensating enough for the heat island effect), to not prove them right.

But even looking at the two graphs he is still wrong. Below you will see the two graphs taken from the original sources one overlayed on top of the other. I have squashed and stretched the images as necessary to get both scales to align. The only other alteration I have done is to alter the contrast to highlight the trend over the variation on one graph and coloured the other graph red so that differences can be easily seen. The graphs track each other very well. There is no indication that the one showing recent data (red) has been manipulated in such a way as to make the past colder, as I suspect suyts is trying to insinuate, in fact the older graph in black could be a trend of the other.  If anyone doubts it do the exact same exercise and align up the scales.


It is crystal clear from the data that the warming trend continues into the next decade, as it does in all recognised temperature data sets. Guess what? The Arctic Was NOT Warmer In The Thirties!

However I'm still certain that suyts will claim that the recent data is unreliable. But there is a simple point of logic here; If we chose to believe over reason that the data is unreliable, how can it be claimed that it was cooler than any previous time?


Oh dear poor suyts;

Even Half a Brain Makes You Over Qualified

The globe isn’t warming any more.

This may have come as a shock to anyone with a brain but it's true. I know you might be wondering about certain facts you may have heard like the Global temperature from GISS, HADCRUT , RSS, UAH and BEST all showing a long term warming trend or that nine of the 10 hottest years occurred since 2000.

But don't let all that empirical evidence and your common sense get in the way, the globe isn't warming anymore because it says so in a recent Real Science post. To comment and suggest this claim is a joke means, according the great intellectual Mr. Goddard, that you only have half a brain.

Then again perhaps Goddard is wrong (yet again) and having even half a brain makes you over qualified to have a rational debate with him and most of his followers, as none at the time of writing has had the sense to query such and absurd and unfounded claim, some even appear to support him!

Goddard Gets Hot Under the Collar

Mr Steve Goddard is getting hot under the collar and it's not only due to the terrible wild fires in Colorado, it's the result of the media highlighting the possibility that the wild fires may have been exasperated due to global warming.

So much so he is again misleading his, largely ignorant, following on his blog. It's uncertain if he does this deliberately or through his own basic ignorance - it's difficult to tell, but both James Hansen and Phil Jones get targeted by his nonsense - I mean his 'theory' - that they are wrong because temperatures have not increased in Boulder Colorado so global warming cant be linked to these wild fires.

The thing is, it doesn't take much on an intellect to realise that temperature isn't the main factor in wild fires, it's drought. Temperature isn't even the main factor in drought, it lack of water. So what does current drought conditions for Colorado look like;

It went from this;


To this in just over two months;


But Mr. Goddard isn't likely to reveal this to his readers any time soon.

Mass Migration

Mass Migration of species toward the pole due to climate change has led to Mass Migration of reason from Steve Goddard at Real Science - he even gave me some credit for the post showing so much misunderstanding of science that even those in remedial education should spot it.

Recently I provided a link to a meta study for a commenter on a Real Science post who stated;
“Migration towards the poles has not been observed.”
The link I provided showing this was simply untrue was a report nearly a year ago called 'Rapid Range Shifts of Species Associated with High Levels of Climate Warming' published in Science.

It appears that Goddard was displeased with real scientific research being linked on his blog because he used my link as the subject of another post that turned out to be wrong in some many embarrassing ways.

In his post he asks;
"Why is it necessary for the government to keep wasting billions of dollars repeating the same cherry picked study over and over and over again?"
Clearly he doesn't really understand what a meta study is. This wasn't a single study let alone a repeated one.


It was a meta analysis of 54 separate studies that looked at data for over 2000 animal and plant species and found that species were moving toward the poles or to higher elevations at an average rate of around 20 cm per hour, faster than a previous study found in 2003.

Goddard then states;

"Why doesn’t someone do an honest study – which starts in the 1940s? We see 1970s cherry picking in almost every single study coming out now. It is worse than intentionally deceptive, as it is intended to defraud the reader into drawing a wrong conclusion which the larger data set does not support."
Not honest, intentionally deceptive, cherry picking?  It appears he is suggesting that this study chose data just from the 1970s to give the impression that species were moving, but if a study looked at a longer period of time this would not be the case. You see it 'was very cold during the 1970s', so all these 2000 species must have wandered south during that time and are just waltzing back again now. An 'honest' study starting from the 1940s would show that - well that appears to be what Mr Goddard is saying. He even provides his version of the GISS temperature graph just to prove it 'was very cold in the 1970s'. The official GISS graph is below.


The 70s were a little cooler than 1940s to be sure but that was warmer than all previous years - wouldn't starting a study from then be cherry picking? In any case it is clear that even the 70s were just part of an overall warming trend that began after 1900 so if Goddard's theory where species continually wander north and south and up and down is true, then they have been migrating both north and higher for several decades before 1940 in response to warming, just as this honest study continues to prove.

As to cherry picking, can Goddard point to any species data from the 1940s that could be included in a study such as this and would support his preposterous claims of these scientists being intentionally deceptive and dishonest? Without such evidence his beliefs are just unproven ramblings of an unqualified conspiracy theorist blogger. Suitable studies do not date back that far but it is reasonable to assume based on the evidence of this research that species also migrated due to warming as long as there has been a warming trend and according to the GISS graph that pre-dates 1940.

However if Goddard was even slightly interested in science he would have looked at this meta-study and saw that many of the studies used actually did use data sets older than 1970, many were from the 60s and even one from as far back as 1947.


But now comes Mr. Goddard's biggest howler as he goes for a hat-trick; His claim that  the government is wasting billions of taxpayer dollars repeating this research. Ignoring that he is wrong about this being repeated research, and forgiving his alarmist 'wasting billions of dollars' shriek, this study was carried out by scientists in the Department of Biology at the University of York, England. Not a single taxpayer dollar was used.

Irony Bypass

With a total irony bypass, Steve Goddard says;
"In the case of continental drift, it took almost 70 years to accept the evidence, and allow the science to proceed."
Anthropogenic Climate Change is based on basic science well over a century old and with good evidence to support current warming is caused by it for a few generations. Thankfully it hasn't taken the scientific community as long to accept it as it did continental drift. We can only hope that it will not take Goddard and his cronies much longer.

Steve Goddard Caught Lying?

To my recollection I have never directly called anyone a liar on any of the forums or blogs I have posted on as such terms prove too emotive which tends to get in the way of mature discourse. But have I caught Steve Goddard of Real Science in a bare faced lie?


In my last post I showed how Goddard's foolish attempts to slag of Prof. James Hansen backfired as it would seem Hansen made the correct call some 26years ago. I visited Goddard's post to reveal this with a link to my analysis, and no doubt embarrassed he responded with;
"I have never visited your blog"
Which is a rather strange thing to say since as a response to a post where I caught him doctoring maps he responded with a post on his own blog called 'Enough Is Enough' where he claimed that I had 'written thousands and thousands of lines all over the Internet' and he emailed me directly calling me 'scum' and a 'liar' as reported here.

  • How did he reach his conclusions without ever reading what they were? 
  • How did he get my contact information without visiting the blog he claims to have never visited?

I suppose someone could have told him what my post contained and gave him the contact information, which would mean that he resorted to name calling based on hearsay. Far worse than lying in my book and someone who would do that would certainly be capable of lying too.

Or perhaps he just forgot he did. That would surprise me in the light of the embarrassing climb down he had to do when someone else realised his maps were botched and he crossed out what he said about me and issued a correction for his post. You'd think he be likely to remember doing that.

So have I caught Steve Goddard telling porkies? The evidence strongly suggests I have.

Real Science Proves Hansen Correct Again.

In a Real Science post, as usual aimed more at right wing politics than real science, Steve Goddard quotes James Hansen from 1986;
"Within 15 years, said Goddard Space Flight Centre honcho James Hansen, "global temperatures will rise to a level that hasn't existed on Earth in 100,000 years"
 Mr Goddard should look rather foolish as Hansen was right. Antarctic Ice Cores from Vostok  revealing temperatures going back 800,000 years show that present temperatures are warmer than at any time in over the last 100,000 years. This is something that was unknown to science back in 1986, so whether Hansen made a lucky guess or an inspired one, he was right.

This figure shows historical CO2 (right axis) and reconstructed temperature (as a difference from the mean temperature for the last 100 years) records based on Antarctic ice cores, providing data for the last 800,000 years.
 
This isn't the fist time Goddard has shown Hansen to be correct even though he remains in denial. Like many foolish people Goddard doesn't know when to quit and his defence of this evidence is to incorrectly insist that;
"According to ice cores, temperatures peaked 8,000 years ago"
 This is an old denier fallacy which was promoted by people like Don Easterbrook and long debunked by sites like Skeptical Science. 8000 years was a warm period and Easterbrook presented graphs like this one that that showed just that;


But as can be clearly seen, Easterbrooks 'present ' times stopped in 1855 just as current global temperatures started to rise. It would be rather inconvenient for a science denier to include modern temperatures and highlight that present warming really is at an unprecedented high, not seen for many thousands of years. Clearly Goddard and his other foolish promoters of myths are living in the past as current average global temperatures are higher than 8000 years ago and as shown higher than over 100,000 years ago just as Hansen said they would be.
 "There are two kinds of fools: those who can't change their opinions and those who won t."

Goddard's Appeal to Athority

Steve Goddard continues to misrepresent Hansen to misinform his readers, and probably himself.

As previously reported he accuses Hansen of calling or declaring a permanent drought in the US, when what Hansen actually said was, there would be a semi-permanent drought over the next several decades with rain, when it does come, occurring in extreme events with heavy flooding.

He repeated a similar claim in his 'Warming To Bring Permanent Drought And Permanent Flood To The Midwest' post and said;
 "No sooner than Hansen declared permanent drought for the midwest – we get a new global warming report warming of permanent floods in the midwest."

Well as  anyone can see Hansen has never declared a permanent drought and certainly no drought for this present time. Nor has there been any war(n)ing of permanent floods. Why does Goddard feel the need to make this easily refuted stuff up?

Just to reiterate, what we have is drought conditions being alleviated somewhat by heavy rain. Doesn't that fit exactly what Hansen suggests will happen over the next several decades?
“Over the next several decades, the Western United States and the semi-arid region from North Dakota to Texas will develop semi-permanent drought, with rain, when it does come, occurring in extreme events with heavy flooding.”

But it gets better. When I said "Shouldn’t that be Semi-permanent drought over several decades?", Mr Goddard replied with his usual politeness;
" I have been hearing the exact same crap for three decades already."

So straight away on being challenged Goddard drops the permanent drought claim - though don't hold your breath for a correction.

It seemed only fair that I should suggest he provide a quote of Hansen saying 'the exact same crap' three decades ago and he kindly provided a link to this news article about US drought in 1988;

Now any one with a keen intellect will immediately realise, (sorry Mr Goddard that can't include you), that 1988 can't be said to be three decades ago.

The article itself is also an interesting read in light of Goddard's claim. Although Hansen is quoted in it, and there is a quote "It is an example of the kind of drought that will occur more frequently as global warming become larger", this wasn't said by Hansen, but Manabe, a soil specialist.

However, something I found rather amusing happened in our conversation when I asked Goddard if he really did think 1988 was three decades ago. He replied in his usual amiable way;
"You are a know nothing idiot child. I was working on global warming studies at Los Alamos in 1980."
Well 1980 is over three decades ago so I will give him that but perhaps he should have quoted his own published Global Warming research instead of a news article eight years later.

Blow me, isn't that a prime example of the Fallacy: Appeal to Authority? Only using Goddard's view of his own self importance to make himself the authority?