Showing posts with label Real Science. Show all posts

Record-High Antarctic Sea Ice Levels Don't Disprove Global Warming

The region's ice has weathered global warming better than Arctic ice

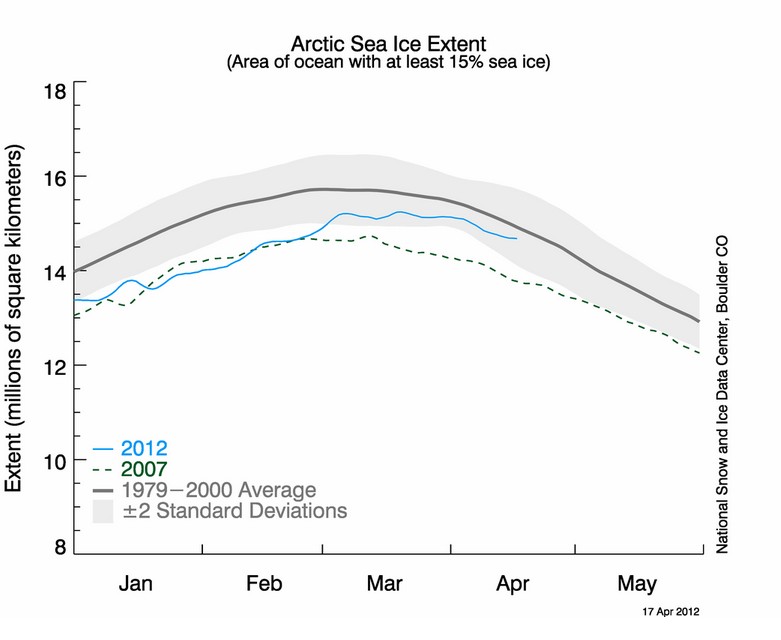
Steve Goddard must be feeling shell shocked. Only a few months ago at the winters peak, the Arctic Sea Ice extent (not volume) was almost normal which he touted loudly on his blog, only to see the fastest melt on record to a new low. With the Battle lost he turns his attention to the Antarctic winter and the growing ice there.

This is a repost from SKYE at weather.aol.com
(Credit: Jeremy Potter NOAA/OAR/OER)
Distracting from the news that Arctic sea-ice extent reached a record low on Sept. 16 is a widely circulating blog article claiming that at the opposite end of the Earth, Antarctic sea ice is more than making up for the losses.

In the post, climate change skeptic and blogger Steven Goddard states that Antarctic sea ice reached its highest level ever recorded for the 256th day of the calendar year on Sept. 12. He reasons that the Southern Hemisphere must be balancing the warming of the Northern Hemisphere by becoming colder (and thus, net global warming is zero).

The National Snow & Ice Data Center (NSIDC), which tracks sea ice using satellite data, explains on its website why Antarctic ice has weathered global warming more robustly than Arctic ice. Goddard dismisses the explanation, concluding instead, "Antarctic and Arctic ice move opposite each other. NSIDC's dissonance about this is astonishing."

Despite its lack of scientific support, Goddard's post has garnered attention around the Web. In a Forbes.com column about the record high Antarctic sea ice, skeptic James Taylor writes, "Please, nobody tell the mainstream media or they might have to retract some stories and admit they are misrepresenting scientific data."

But if anyone had asked an actual scientist, they would have learned that a good year for sea ice in the Antarctic in no way nullifies the precipitous drop in Arctic sea-ice levels year after year - or the mounds of other evidence indicating global warming is really happening.

"Antarctic sea ice hasn't seen these big reductions we've seen in the Arctic. This is not a surprise to us," said climate scientist Mark Serreze, director of the NSIDC. "Some of the skeptics say 'Well, everything is OK because the big changes in the Arctic are essentially balanced by what's happening in the Antarctic.' This is simply not true." [Former Global Warming Skeptic Makes a 'Total Turnaround']

Projections made from climate models all predict that global warming should impact Arctic sea ice first and most intensely, Serreze said. "We have known for many years that as the Earth started to warm up, the effects would be seen first in the Arctic and not the Antarctic. The physical geography of the two hemispheres is very different. Largely as a result of that, they behave very differently."

The Arctic, an ocean surrounded by land, responds much more directly to changes in air and sea-surface temperatures than Antarctica, Serreze explained. The climate of Antarctica, land surrounded by ocean, is governed much more by wind and ocean currents. Some studies indicate climate change has strengthened westerly winds in the Southern Hemisphere, and because wind has a cooling effect, scientists say this partly accounts for the marginal increase in sea ice levels that have been observed in the Antarctic in recent decades.

"Another reason why the sea-ice extent in the Antarctic is remaining fairly high is, interestingly, the ozone hole," Serreze told Life's Little Mysteries. This hole was carved out over time by chlorofluorocarbons, toxic chemicals formerly that were used in air conditioners and solvents before being banned. "The ozone hole affects the circulation of the atmosphere down there. Because of the ozone hole, the stratosphere above Antarctica is quite cold. Ozone in the stratosphere absorbs UV light, and less absorption [by] ozone makes the stratosphere really cold. This cold air propagates down to the surface by influencing the atmospheric circulation in the Antarctic, and that keeps the sea ice extensive."

But these effects are very small, and Antarctic sea-ice levels have increased only marginally. In the coming decades, climate models suggest rising global temperatures will overwhelm the other influences and cause Antarctic sea ice to scale back, too.

The extent of Arctic sea ice at its summertime low point has dropped 40 percent in the past three decades. The idea that a tiny Antarctic ice expansion makes up for this - that heat is merely shifting from the the Southern Hemisphere to the Northern and therefore global warming must not be happening - is "just nonsense," Serreze said.

Idiotic Denier Of The Day

Some awards come easily to some people and this one for Idiotic mis-interpretation of the evidence is well deserved by Steve Goddard and awarded to him over at uknowispeaksense, full repost below;

Idiotic denier graph of the day, August 26,2012

Yep, something a little different. I got my 3-year-old niece to draw on a piece of paper with a fat blue crayon and this is what she drew.
Conrats Steve Goddard! You have graduated from preschool.
Yes, ok. You got me, my niece would never use such a fat crayon to draw a graph, unless she wanted it to be fuzzy. This masterpiece is the work of Steve Goddard who, at his woefully misnamed blog, “Real Science” is trying to debunk a strawman. According to Steve, in 2007 AGW proponents, “went hysterical and told us that the Arctic would be ice free by 2008, 2010, 2012 or 2013″ and then provided this……..graph to debunk it. Of course, Steve ‘I just graduated preschool’ Goddard, didn’t provide a reference to these statements. So some mythical scientists have been debunked. Well done Steve, well done. You really showed…….them. Of course, my mate Geoffrey Brown faithfully cut and paste the same graph over at my favourite denier den, the official blog of the Climate Sceptics Party and included an admission to being a conspiracy theorist of the highest order, but that’s for another day.
So what of this….graph? Well, Steve supplied a link to the data he has used for his blue crayon special and it seems it goes all the way back to 1979. It’s no wonder he cherrypicked the last few years. Here’s a graph or two from the same website. First, what Steve’s magic blue crayon graph would have looked like if he used all the data.


Next, let’s take it back a little further and look at the longer term trend broken down into seasons.
So, there you have it. “Real Science” and real science. Which are you going to accept? Personally, I think I’ll go with the latter. I’m not really into crayons.

Steve Goddard Calls It Right!

Having been censored and banned - though intermittently I have got a post through - from the Orwellian named Real Science, I decided to look at what if anything the not so good Mr Goddard had to say about such things and to my surprise he calls the practice  of censorship correct;

Refusal To Debate : Symptom Of A Liar

 He apparently believes in defending free speech, (but only when it is him who is speaking), and bitterly complains about blogs he believes have a policy of censorship, here and here.

So now we can all agree that not only is the person going by the name of Steve Goddard and Liar but a hypocrite .


Steve Goddard BS – Worse Than It Seems

In what must be the strangest and most desperate post on Real Science about Arctic Sea Ice, (Currently at a record low extent), Steve Goddard posts a part picture of the Arctic from arctic.io, rephotographs it off the monitor with his phone, which apparently 'does some color/gamma correction automatically', to make the claim that there is more ice in that region than is apparently obvious in the picture!

Well that it seems is all the evidence this right wing-nut needs to dismiss all the evidence of ice melt this year. Forget this graph of declining see ice extent;

From http://tamino.wordpress.com/2012/08/22/is-climate-really-changing/
 Forget about these from NSIDC;


Forget about all the actual evidence, because Steve Goddard of Real Science has got a camera phone! I wonder what sort of App? Seriously, I thought I would find using real science to debunk skeptical arguments on blogs like Real Science at least a bit of a challenge but then you get idiot posts from Goddard like this.

He Could Have Been Born Yesterday

I may have mentioned on here before that Steve Goddard is a 'Birther' in that he believes Americas first non-white president wasn't born in the US so can't really be the President.

In a recent post he provides 'evidence' from a paper that Barack Obama was born in Kenya. Straight away a commenter pointed out that was was an old hoax and documented in snopes, other facts were added including evidence that his father was in Hawaii at the time he was born and unlikely to send his pregnant wife to a third world country to give birth. No record of any such journey exists for there and back in any case. There does exist a birth certificate form a Hospital in Honolulu and confirmed as authentic. We also have Kenyan official denying that Obama was born there. This is in comments by people who are normally very supportive of Goddard's climate denial posts but obviously are unwilling to stoop to this whole new level of crazy.

Steve Goddard is having none of it. The link he has is all the proof that is needed.

So we have multiple lines of evidence all pointing to one conclusion and a single piece of discredited evidence pointing to another. Which does Goddard support? The one that tells him what he want to hear of course.

Remind you of anything?

Northern Hemisphere’s shifting curve.

Steve Goddard and others are having a hard time deflecting attention from climate change with the weather extremes that are occurring around the world this year and people are starting to notice. They have been scouring the records to find a headline to mislead with. Here is an example for the Orwellian 'Real Science'; 'US Summers Getting Cooler Since 1895', and it even comes with a graph to prove it;

This certainly indicates a decline in the summer temps shown so how can there be more climate extremes now? The answer is in the graphs title, 'Summer Maximum Temperatures' and I was going to do a long post on it but when I found it has been explained rather well over at 'uknowispeaksense', I thought plagiarism is so much easier than origionality so I will let them take up the story;

I’ve already had one commenter in here point out a bunch of cherrypicked individual high temperature records from all sorts of places and from different times and asking me how there can be new extremes as reported by James Hansen if these records haven’t been broken. Of course Hansen’s data is dealing in average temperatures not indivdual records. As the average temperatures increase the bell curve shifts to the right indicating that on average, extreme highs will increase and extreme lows decrease. Without bothering to check the credibility of the data that suggests that in Seville, Spain on August 4, 1881 it was 122 degrees F, and assuming it is correct, my question is, so what? We are not dealing with individual time points here, we are dealing with decadal averages. That said, here’s the thing, average global temperatures are rising. That fact is indisputable. That also means maximum temperature anomalies and outliers will continue to be superceded. It is inevitable. Continuing to try and muddy the waters with erroneous outliers just demonstrates how desperate deniers are to hang on to their evermore untenable positions. It is sad.

Here is a page with some excellent graphics. The first, showing the increasing number of “hot” and “very hot” summers in the northern hemisphere and the second, the graphic highlighting the shift to the right.
http://www.nasa.gov/topics/earth/features/warming-links.html


Warmer In The Thirties - I think NOT

A regular commenter on the Orwellian named 'Real Science' is someone called suyts who has merited a mention on Really Sciency before for his ‘some pale shading’ and his warped logic achieving 'muppet' status. Well this guy has his own blog which reaches a whole new level of crazy.

Recently the 'syuts place' blog made a very specific claim - "Arctic Was Warmer In The Thirties!!". Yes the two exclaimation marks were his just to show how significant he wanted the claim to be considered. He even included graphs picked out from actual credible sourses to prove it;

"I added the thick black line" appears on the NASA version by suyts.
The actual source for his graph is Warming Trends in the Arctic from Clear Sky Satellite Observations, JOSEFINO C. COMISO, from NASA Goddard Space Flight Center which appeared in Journal of Climate way back in 2003, via NASA's "Evidence of Arctic Warming" page.

It is true that the 'thick black line' shows that the temperature trend was higher in the thirties than it is by the end of the graph. However if you read the paper you find that Comiso and the research fully support the global warming theory - as does NASA. There is no doubt about this and the Abstract clearly states;
The longer-term in situ surface temperature data shows that the 20-yr trend is 8 times larger than the 100-yr trend suggesting a rapid acceleration in the warming that may be associated with the recent change in phase of the Arctic Oscillation that has been linked to increasing greenhouse gases in the atmosphere.
So basically suyts has cherry picked a graph, altered it a little and taking it out of context has added his own denial spin that is totally at odds from the actual published research - a typical tactic when no real research supports your beliefs.

But is there any evidence that the Arctic Was Warmer In The Thirties?

I commented on suyts post to make two specific points;

First, as another poster, uknowispeaksense, (whose rather good blog I have been following for a while), says: "So What?" Cherry picking one area to suggest something significant about Global temperatures is wrong on so many levels. It a tired old tactic. Find an area that might just be bucking the trend for now and highlight it. Then when challenged claim that you were never suggesting it related to anything else. Of course if this were true and the person was honest, this would have been stated from the outset - "This area was warmer in the past than it is today - even though most other areas have warmed more now". This sort of level of openness and honesty is rarely found in those who are desperate to find something to support their beliefs.

So simply put, even if suyts is correct in his statement that the "Arctic Was Warmer In The Thirties", (and he isn't as I will show), without a global context the statement is as significant as saying refrigerators were as warm in the thirties. 

The second point I wanted to make is obvious to anyone with the slightest hint of real scepticism. The graph presented stops over a decade ago. I included a link showing more recent temperatures from NOAA's Arctic Report Card. This is from 2011;

This time the black line has been added by me


It clearly shows that while the peak trend in thirties was high in 2000, where Comiso's data ends, that by 2003 the temperature trend exceeds any in the record. Natural variation still causes the temperature to drop below my line but the overall direction of the trend is clear and with 2012 so far the warmest recorded for the Northern Hemisphere I strongly suspect that trend is likely to continue.

So what response does someone get from suyts for highlighting more recent data that clearly shows that the Arctic was NOT warmer in the thirties?
"I thought it was you guys who put so much stock in “peer-review”."
 I assume that this response is because the NOAA graph is from their report card and suyts graph is cherry picked and  misrepresented from research that is totally at odds from his beliefs.

He also replied;
"warmists, for some reason, don’t like this graph. They aren’t very explicit as to why"
Clearly Language comprehension isn’t his strong suit and the meaning of  “the graphs presented stop over a decade ago” was out side his range of understanding. I then asked him specifically “Do you accept that the recent temperature data for the area shows your headline to be false?” His direct answer was No. The graphed data demonstrably shows that he is wrong. His reasoning was bizarre;
"Now, using the same data set as COMISO, show that I’m wrong."
Why would I have to show him wrong? It must be accepted from the data I presented that his headline clearly is wrong. Logic would state it is up to him to present evidence to the contrary, especially since he had presented no recent data to support his recent claim. A bit like stating flared trousers are the height of fashion and proving with a picture from the 1970s.

suyts  - height of fashion?

 As for using the same data that was used in the Comiso paper, that data ended in 2000 but it was data approved by NASA just as the data used in the NOAA graph - except of course that data was more current.

There was of course a lot more rambling but none of it provided any support for the Warmer In The Thirties claim. Undeterred by his irrational nonsense I decided to spell out what would be acceptable evidence
"The NOAA document I have linked shows Arctic up to 2010 and clearly shows a peak about 0.7 kelvin above the 30s peak. By all means show ANY data from a recognised source covering the same area and time frame you prefer if you can find any actually showing the ‘Arctic Was Warmer In The Thirties’."
 It was at this point that he started to believe he was Batman!
Wholly crap Laz! ...  What is implicit throughout the entire post and comments are that none of the present data sets show what was once shown. Notice how your NOAA offering butchers the data?
Ah, so that's it. A conspiracy, the data has been manipulated in nefariousness ways. I actually knew this was coming because in a previous comment I stated I was "not really interested in any conspiracy nonsense" he would concoct. The psychological problem with those that believe in conspiracy theories is that by necessity they do not think them a conspiracy. I'm not suggesting that he is wrong about data adjustments. They are necessary to reduce uncertainties as the science improves. The problem is that the conspiracy theorist will always believe that they have either been altered to prove them wrong or not altered, (in the case of not compensating enough for the heat island effect), to not prove them right.

But even looking at the two graphs he is still wrong. Below you will see the two graphs taken from the original sources one overlayed on top of the other. I have squashed and stretched the images as necessary to get both scales to align. The only other alteration I have done is to alter the contrast to highlight the trend over the variation on one graph and coloured the other graph red so that differences can be easily seen. The graphs track each other very well. There is no indication that the one showing recent data (red) has been manipulated in such a way as to make the past colder, as I suspect suyts is trying to insinuate, in fact the older graph in black could be a trend of the other.  If anyone doubts it do the exact same exercise and align up the scales.


It is crystal clear from the data that the warming trend continues into the next decade, as it does in all recognised temperature data sets. Guess what? The Arctic Was NOT Warmer In The Thirties!

However I'm still certain that suyts will claim that the recent data is unreliable. But there is a simple point of logic here; If we chose to believe over reason that the data is unreliable, how can it be claimed that it was cooler than any previous time?


Oh dear poor suyts;

Even Half a Brain Makes You Over Qualified

The globe isn’t warming any more.

This may have come as a shock to anyone with a brain but it's true. I know you might be wondering about certain facts you may have heard like the Global temperature from GISS, HADCRUT , RSS, UAH and BEST all showing a long term warming trend or that nine of the 10 hottest years occurred since 2000.

But don't let all that empirical evidence and your common sense get in the way, the globe isn't warming anymore because it says so in a recent Real Science post. To comment and suggest this claim is a joke means, according the great intellectual Mr. Goddard, that you only have half a brain.

Then again perhaps Goddard is wrong (yet again) and having even half a brain makes you over qualified to have a rational debate with him and most of his followers, as none at the time of writing has had the sense to query such and absurd and unfounded claim, some even appear to support him!

Goddard Gets Hot Under the Collar

Mr Steve Goddard is getting hot under the collar and it's not only due to the terrible wild fires in Colorado, it's the result of the media highlighting the possibility that the wild fires may have been exasperated due to global warming.

So much so he is again misleading his, largely ignorant, following on his blog. It's uncertain if he does this deliberately or through his own basic ignorance - it's difficult to tell, but both James Hansen and Phil Jones get targeted by his nonsense - I mean his 'theory' - that they are wrong because temperatures have not increased in Boulder Colorado so global warming cant be linked to these wild fires.

The thing is, it doesn't take much on an intellect to realise that temperature isn't the main factor in wild fires, it's drought. Temperature isn't even the main factor in drought, it lack of water. So what does current drought conditions for Colorado look like;

It went from this;


To this in just over two months;


But Mr. Goddard isn't likely to reveal this to his readers any time soon.

Mass Migration

Mass Migration of species toward the pole due to climate change has led to Mass Migration of reason from Steve Goddard at Real Science - he even gave me some credit for the post showing so much misunderstanding of science that even those in remedial education should spot it.

Recently I provided a link to a meta study for a commenter on a Real Science post who stated;
“Migration towards the poles has not been observed.”
The link I provided showing this was simply untrue was a report nearly a year ago called 'Rapid Range Shifts of Species Associated with High Levels of Climate Warming' published in Science.

It appears that Goddard was displeased with real scientific research being linked on his blog because he used my link as the subject of another post that turned out to be wrong in some many embarrassing ways.

In his post he asks;
"Why is it necessary for the government to keep wasting billions of dollars repeating the same cherry picked study over and over and over again?"
Clearly he doesn't really understand what a meta study is. This wasn't a single study let alone a repeated one.


It was a meta analysis of 54 separate studies that looked at data for over 2000 animal and plant species and found that species were moving toward the poles or to higher elevations at an average rate of around 20 cm per hour, faster than a previous study found in 2003.

Goddard then states;

"Why doesn’t someone do an honest study – which starts in the 1940s? We see 1970s cherry picking in almost every single study coming out now. It is worse than intentionally deceptive, as it is intended to defraud the reader into drawing a wrong conclusion which the larger data set does not support."
Not honest, intentionally deceptive, cherry picking?  It appears he is suggesting that this study chose data just from the 1970s to give the impression that species were moving, but if a study looked at a longer period of time this would not be the case. You see it 'was very cold during the 1970s', so all these 2000 species must have wandered south during that time and are just waltzing back again now. An 'honest' study starting from the 1940s would show that - well that appears to be what Mr Goddard is saying. He even provides his version of the GISS temperature graph just to prove it 'was very cold in the 1970s'. The official GISS graph is below.


The 70s were a little cooler than 1940s to be sure but that was warmer than all previous years - wouldn't starting a study from then be cherry picking? In any case it is clear that even the 70s were just part of an overall warming trend that began after 1900 so if Goddard's theory where species continually wander north and south and up and down is true, then they have been migrating both north and higher for several decades before 1940 in response to warming, just as this honest study continues to prove.

As to cherry picking, can Goddard point to any species data from the 1940s that could be included in a study such as this and would support his preposterous claims of these scientists being intentionally deceptive and dishonest? Without such evidence his beliefs are just unproven ramblings of an unqualified conspiracy theorist blogger. Suitable studies do not date back that far but it is reasonable to assume based on the evidence of this research that species also migrated due to warming as long as there has been a warming trend and according to the GISS graph that pre-dates 1940.

However if Goddard was even slightly interested in science he would have looked at this meta-study and saw that many of the studies used actually did use data sets older than 1970, many were from the 60s and even one from as far back as 1947.


But now comes Mr. Goddard's biggest howler as he goes for a hat-trick; His claim that  the government is wasting billions of taxpayer dollars repeating this research. Ignoring that he is wrong about this being repeated research, and forgiving his alarmist 'wasting billions of dollars' shriek, this study was carried out by scientists in the Department of Biology at the University of York, England. Not a single taxpayer dollar was used.

Irony Bypass

With a total irony bypass, Steve Goddard says;
"In the case of continental drift, it took almost 70 years to accept the evidence, and allow the science to proceed."
Anthropogenic Climate Change is based on basic science well over a century old and with good evidence to support current warming is caused by it for a few generations. Thankfully it hasn't taken the scientific community as long to accept it as it did continental drift. We can only hope that it will not take Goddard and his cronies much longer.

Goddard's Appeal to Athority

Steve Goddard continues to misrepresent Hansen to misinform his readers, and probably himself.

As previously reported he accuses Hansen of calling or declaring a permanent drought in the US, when what Hansen actually said was, there would be a semi-permanent drought over the next several decades with rain, when it does come, occurring in extreme events with heavy flooding.

He repeated a similar claim in his 'Warming To Bring Permanent Drought And Permanent Flood To The Midwest' post and said;
 "No sooner than Hansen declared permanent drought for the midwest – we get a new global warming report warming of permanent floods in the midwest."

Well as  anyone can see Hansen has never declared a permanent drought and certainly no drought for this present time. Nor has there been any war(n)ing of permanent floods. Why does Goddard feel the need to make this easily refuted stuff up?

Just to reiterate, what we have is drought conditions being alleviated somewhat by heavy rain. Doesn't that fit exactly what Hansen suggests will happen over the next several decades?
“Over the next several decades, the Western United States and the semi-arid region from North Dakota to Texas will develop semi-permanent drought, with rain, when it does come, occurring in extreme events with heavy flooding.”

But it gets better. When I said "Shouldn’t that be Semi-permanent drought over several decades?", Mr Goddard replied with his usual politeness;
" I have been hearing the exact same crap for three decades already."

So straight away on being challenged Goddard drops the permanent drought claim - though don't hold your breath for a correction.

It seemed only fair that I should suggest he provide a quote of Hansen saying 'the exact same crap' three decades ago and he kindly provided a link to this news article about US drought in 1988;

Now any one with a keen intellect will immediately realise, (sorry Mr Goddard that can't include you), that 1988 can't be said to be three decades ago.

The article itself is also an interesting read in light of Goddard's claim. Although Hansen is quoted in it, and there is a quote "It is an example of the kind of drought that will occur more frequently as global warming become larger", this wasn't said by Hansen, but Manabe, a soil specialist.

However, something I found rather amusing happened in our conversation when I asked Goddard if he really did think 1988 was three decades ago. He replied in his usual amiable way;
"You are a know nothing idiot child. I was working on global warming studies at Los Alamos in 1980."
Well 1980 is over three decades ago so I will give him that but perhaps he should have quoted his own published Global Warming research instead of a news article eight years later.

Blow me, isn't that a prime example of the Fallacy: Appeal to Authority? Only using Goddard's view of his own self importance to make himself the authority?


Normal Service Has Been Resumed

After the hack at Steven Goddard Orwellian named 'Real Science' web site that resulted in no posts for several days, normal service has been resumed.

The latest post still rejects science and rationality. It still denies global warming is happening. It still promotes conspiracies including '“Global Warming” to scare the masses and make lots of money while controlling nations'.

The only real difference is that this post isn't from the guy who calls himself Steven Goddard, he still seems to have lost control of his domain, but by someone calling themselves Richard Garwin.

There is a rather eminent physicist called Richard Garwin, now 84 years old, and a Board member of the Union of Concerned Scientists, but this clearly isn't Goddard's hacker.


The post has received quite a lot of interest form Goddard's usual commenters but they seem unhappy with it for some reason and I can't quite put my finger on what it is. Perhaps this Richard Garwin is slightly more extreme in his conspiracy theories with talk of Elitists, Weather Control and UFOs, but it hardly makes less sense that Goddard's 'Birther' conspiracies for example. But what is assured is that their ability to think rationally remains just as impaired;

'Ano' suspects the hack could be down to the warmists;
I would suspect it might be a guy from Desmog Blog. This is their kind of thing
 'Dave Burton' agrees;
I suspect that the person impersonating Richard Garwin is a climate alarmist having some fun at skeptics’ expense.

Meanwhile, normal service has been resumed by Steve Goddard himself over at his old Worprdpress blog where his own anti-science, conspiracy theory nonsense continues.

Unfortunately so does the nonsense that the hack was an attack carried out by the warmists, 'ntesdorf' says:
Dirty tricks are all that the Warmists really know.
  And 'Rogelio' says:
I still think that that site was stolen because it is and was really doing major damage to the AGW. I cannot possibly contemplate any other reason
Apparently it was even believed that Richard Garwin the physicist, was responsible for the hack, 'foxgoose' says;
Is he really a Board Member of the Union of Concerned Scientists?
Hilarious!
Obviously they’re a lot more “concerned” than we thought.

 All this despite Goddard's best efforts and continued claims that this incident has nothing to do with either. You really could not make this stuff up.

Ruffled Feathers But No lessons Learned

My previous post on the flaws of Goddard's colouring in and counting project seems to have ruffled a few feathers. Within a few hours he made several posts on sea ice extent, but has not learned from his mistakes - in fact he keeps making the same errors over and over.

In this post he is still colouring in but he doesn't rotate the image this time - what was all that about?


And Mr Goddard now proudly states;
"My pixel counts agree with Cryosphere Today numbers, which show more excess ice in the Bering Sea, than missing ice in the Barents Sea."
 I am at a loss as to why he has gone to the trouble of repeating the same flawed exercise to try and get his pixel count to agree with  Cryosphere Today. Why not just accept the information on Cryosphere Today? Perhaps because it doesn't suggest that the data "should be showing Arctic ice extent slightly above normal, for the first time in nearly ten years", his original and erroneous claim.


But he is still making the same mistakes. I hand you over to  Peter Ellis, a real sceptic and someone who has noticed problems with Goddard's analysis and similar problems with this map as I did in my original post. This is his comment to Steven Goddard;

Peter Ellis says:
April 19, 2012 at 3:33 pm

You count does not agree with Cryosphere Today numbers, since they show a current overall area anomaly of -0.103 million sq km. You can’t just pick two regions and ignore the rest. As far as your pixel count goes, even by eye I can see you missed some pixels in the Greenland sea. But that omits a larger issue: the pixels that comprise the orange line itself. These (being the border of the ice) presumably are ice-covered in the historical mean data. Since we cannot see through the line, we do not know how many of them are ice-covered today. The orange line is several pixels wide and thousands of pixels long. Your count therefore has a minimum error of several thousand, which makes your entire exercise moot.

Regarding the NSIDC figure, the historical average line is not strictly shifted, it’s actually a subtly different shape, since it’s now based on a 5-day average rather than a 9-day average. If you look carefully you’ll see the line is now slightly less smooth.

What does that do to the overall shape? Well, after normalising and taking the current date as day 0, the April 16 graph shows the average of days (-6,-5,-4,-3,-2,-1-0,1,2) , while the April 18th graph shows the average of days (-4,-3,-2,-1,0). That is, there’s no “shift” in that both are centred on day -2, but there is a difference in the size of the smoothing window.

How does the inclusion of days -6,-5,1 & 2 affect the average? Not at all during parts of the year when the rate of gain or loss is ~ linear. However, during this part of the spring, melt is accelerating, and so days 1&2 are further below day -2 than days -6&-5 are above day -2. So, during this part of the year, the 9-day average will be fractionally lower than the 5-day average.

Taken together, that means that going from the 9-day average to the 5-day average, even when correctly centred, will cause the “average” line to rise fractionally. It’s how smoothing works. The reverse will hold true as the melt slows down in August/September, so as we approach the summer minimum the “new” line for the historical average will be fractionally lower than it was on last year’s graphs.
Perhaps it is time Steven Goddard put his crayons away.


Another Look At Goddard's Graph Gaffs

Steve Goddard's inability to understand graph data has led to yet another Gaff on his part. He thinks he has discovered more wrong doing, this time by the US National Snow and Ice Data Center.

He takes the Hi resolution map of Sea Ice Extent  for the 17th of April 2012 and gets his colouring crayons out again to use a very inaccurate and unscientific method to measure the change in extent form the 1979 - 2000 average. Just like in any good comedy of errors he rather predictably gets it all wrong and the farce continues when he uses errant values support his insinuations of skulduggery. I'm certain a good comedy writer could make a whole series out of the errors and misinformation on 'Real Science'. Perhaps it could be call Goddard's Gaffs, featuring a bumbling shambolic character in front of a monitor trying to save the world from a secret shadowy cabal of men in black that don't actually exist.

Here is how Goddard gets it so wrong - again!

He takes the original map from the NSIDC web site;


And, for some reason turns it around, and gets colouring. To end up with the work of art here;


He then claims to count the red (ice loss) and the green (ice gain) and compare them. He states;
"The area of green is 3544 pixels, and the area of red is 2941 pixels."
Which may well be correct, and then uses the difference, a whole 603 pixels to suggest that the sea ice extent must be that much above normal. He then presents the NSIDC graph here to say;
"The NSIDC graph should be showing Arctic ice extent slightly above normal, for the first time in nearly ten years.

Instead, the graph shows well below normal ice extent."


The first ting to notice is that the original image contains over 1.6 million pixels so I doubt very much if 603 pixels is going to be noticeable 'above normal'. But why isn't it showing at least normal?

Well it is all down to 2 gaffs by Goddard. The first is, like any good six year old when it comes to colouring in, they say within the lines, unfortunately they don't always reach the lines sometimes miss bits. Goddard does exactly that  as can be seen here indicated by purple and yellow arrows;


To be honest this probably averages out with missing bits that should be either red or green but this is more like child's play than a 'scientific method' and he is only talking about 603 pixels after all.

The biggest error occurs due to his treatment of the orange 'extent line' itself. The NSIDC clearly indicate that the orange line in the extent image is the1979 to 2000 average extent. That means that the outside of the line is the outside of the extent and should be included as red in every red area. Goddard doesn't bother about any such details.

How much difference can such a thin line really make to Goddard's pixel count if he had done it correctly? When zoomed in on the original NSIDC image the orange line is about 5 pixels wide and it will be thousands of pixels long. That is many thousands of pixels that should have been included and would have offset Goddard's mighty 603 pixels 'above normal' even if he had done his colouring to the lines correctly.

 Clearly Steve Goddard is wrong again and the Arctic Ice Extent should not be 'slightly above normal' and I would suggest that the graph above represents exactly where it should be.

Goddard Has Less Sense Than He Did In 1980

Steve Goddard is at it again, showing he has a blind spot when it comes to understanding the significance of a graph. He just carries on with his own selective interpretation of selected data points and ends up not being wrong yet insinuating nothing that is right. I'd call this behaviour 'Cherry Picking'. Am I right?

The graph in question is from his blog post entitled 'Meltdown 2012 : Earth Has More Sea Ice Than It Did In 1980', and although it was posted on the April 1st I'm certain that it wasn't supposed to be as foolish as it seems.

Goddard includes links to data at ' The Cryosphere Today' site and I am assuming he has graphed the data correctly. Helpfully he rings this years data point and makes the correct claim; " Earth Has More Sea Ice Than It Did In 1980". So what?

Clearly this is an insinuation to some great truth about climate change in the Arctic regions, without saying anything meaningful about them. It appears that he has taken the current value and then hand picked the year furtherest back and at the start of the data set that was lower, i.e. 1980, while gleefully ignoring all other data points in between that might actually be used in determining a meaningful trend or credible conclusion. In fact, by only relying on two data points in a set of 33, he has ignored about 94% of the data to not say anything meaningful - that takes a concerted effort in my book.

Hand picking two data points to the exclusion of all others is how I would define 'Cherry Picking'. However when I mentioned the phase in a comment on Goddard's site he ironically replied;
"Cherry picking the current maximum? Are you as dense as you pretend to be?"
Does the man realise what he says sometimes? Hand picking a maximum, and ignoring over 90% of all other maximums is cherry picking in my book. He repeats the exact same nonsense here, only lists more years from the 80s,  and ignores the clear trends from the mid 90s to the present.


What can we really tell from Goddard's graph? Well there is more sea ice now than most years, and a lot more sea ice than many recent years. So although the sea ice area had recovered on that particular day compared to most years, the clear trend is that global sea ice is of decline when looking at a single day, April 1st, and most of that decreasing trend occurred from the mid 90s with more years than not being lower than this years Fools Day.


Real Science makes Real Climate dreams come true.

The Met Office recently updated their HadCRUT temperature series to version 4 which now includes wider and more complete data sources.

There is a really good overview of the difference between this new version and the last over at Real Climate, but I had to laugh when Steve Goddard posted today;


Met Office : Making Their Own Dreams Come True

It strongly insinuates skulduggery because the Met Office had previously predicted that 2010 would be the hottest year on record, where up to that point in the HadCRUT V3 1998 was considered the hottest. And indeed Version 4 shows two years slightly higher than 1998, 2005 and 2010 draw, but all three years are within the error margins - there is really nothing to choose between them. There really wasn't anything to choose between them with Version 3 either but this update is enough to get Goddard's conspiracy juices flowing.


But the reason why his nonsense is so amusing this time is that in the Real Climate post three days ago Gavin Schmidt says;

"We can look forward to any number of contrarians making before and after plots of the data and insinuating that something underhand is going on. Most of the time, they will never link to the papers that explain the differences. (This is an easy call because they do the same thing with GISTEMP all the time)."

Guess Goddard made his dreams come true!


Goddard: Tampering With Data All Over The Planet

Of course that's Steve Goddard, from the Orwellian named Real Science, and nothing to do with NASA’s Goddard space centre.

Unfortunately Mr. Goddard doesn’t do very well with graphs. We have seen it on Really Sciency before, (still waiting for the correction), and his latest howlers were when he posted the animated .gif below;


Goddard uses this to make the claim;
 “Hansen has been deleting cooling trends all over the planet.”, “He has erased historical cooling trends (blue) in North America, South America, Africa, the Arctic, Antarctica, and elsewhere.”
And very helpfully draws little red rings around the areas he mentions. What he has discovered is shocking! The chilly light blue areas have suddenly become a less chilly looking white. Oh the humanity! Surely this is proof of tampering, proof of erasing cooling trends?

Hang on a moment, what about those very angry looking dark red areas on the same image as the blue (the ones he rather conveniently doesn't draw little red rings around), – haven’t those become a less warm orange? Drat those pesky scientists, (Hansen specifically), they have gone and erased the hot, hot, hot areas, clearly they are erasing warming trends as well! Drat and double drat.

Below I have included the maps as separate images for easy comparison;


But wait – the maps use the same colours but at the bottom they use different scales - Actually Goddard knows this because almost as a foot note he does say;
“The color scales are shifted, but the legends are located below the maps – and you can see that the values have changed.”

The first thing that should ring alarm bells with any true sceptic is that Goddard  thinks comparing two maps with different scales is a perfectly reasonable thing to do. Who with any inkling of science and an idea to communicate would even let such a notion cross their mind and publish such shoddy work as a credible evaluation? Well Steven Goddard obviously.

The second thing is his preoccupation with his own bias. If he is right to be concerned, and cooling trends are really being ‘erased’, then why does this concern not extend to warming trends being erased as well?

Well the truth is obvious, Goddard has his answer and is trying to get ‘facts’ to convince himself and others it is right, instead of looking at all the facts and drawing a rational conclusion from them. If he was an honest man, even believing he's right, he would be as concerned for the changes at both ends of the scale, not just the bits he thought made an anti-AGW case. That is why he will always be prone to cherry picking and making howlers such as the ones I will show below.

So the only question that remains; Is Goddard correct about trends (at either end) being erased?

Goddard actually gives a specific example to reinforce his case;
“The circle over Africa has changed from a -0.5C to -0.3C cooling trend, into a warming trend.”
I can’t see exactly where he got these figures from. The cool area circled over Africa in the first map ranges from around -0.5 to +0.1. In the second map the cool area ranges from around -0.2 to +0.5, so the values are slightly different even if they are not the values Goddard works it out at.

An easier area to work out is the circled U.S. area. It goes from -0.5 to -0.1 in the first map to -0.2 to +0.2 in the second map.

But doesn’t that make Goddard correct about erasing trends? They are different in each map after all. Well all that really depends on if these maps are really showing the same data.

Goddard gives links to where he got the maps from. The second is straight forward; it is the GISS Surface Temperature Analysis using GHCN v3.

The first map however is over 12 years old. Goddard gets if from a brief piece on the NASA, Goddard Institute for Space Studies, web site from August 1999 about the US climate at that time. It is worth a read if only to understand how real scientists view data, not as Steve Goddard has done above, but with guarded statements, based only on what the data, and all the data, supports. Of the drought that occurred in the Eastern U.S. in 1999, Hansen and his team have this to say;

“Was the heat wave and drought in the Eastern United States in 1999 a sign of global warming?
Empirical evidence does not lend much support to the notion that climate is headed precipitately toward more extreme heat and drought. The drought of 1999 covered a smaller area than the 1988 drought, when the Mississippi almost dried up. And 1988 was a temporary inconvenience as compared with repeated droughts during the 1930s "Dust Bowl" that caused an exodus from the prairies, as chronicled in Steinbeck's Grapes of Wrath.”

Does this sound like a scientist prepared to ‘erase’ trends or one that admits the data does not support anthropogenic warming in the U.S. at that time?

Anyway I digress. The map Goddard uses for his ‘before’ has been taken from the article mentioned, but it is actually from a 1999  paper; 'GISS analysis of surface temperature change'; by J. Hansen, R. Ruedy, J. Glascoe, and M. Sato.

There is a lot of mapped data in this 1999 paper but you will find the one used by Hansen in the US climate article, and subsequently used by Goddard, as the first map on Plate 4.

This map is GISS Surface Temperature Analysis using GHCN v2.

Any one spot the difference? Yes, the maps are not even displaying the same data! What a silly boy Steve Goddard is. The first shows GHCN v2 and the second GHCN v3.


In November 2011 NASA switched from GHCN v2 to GHCN v3, since GHCN v2 was no longer updated. I expect that Goddard and his minions may now try and claim that the change to the new data set is proof that they altered the data. But it is clear Steve Goddard had no idea that this was the case, and certainly never thought to check where the discrepancy was - a real sceptic would.

So before they make any such claims of data alteration, they should note that this was a well documented change. There is a whole page at NASA, comparing the differences between version 2 and version 3.

http://data.giss.nasa.gov/gistemp/updates_v3/V3vsV2/
And you will recognize the same kind of differences that Steve Goddard has only just managed to figure out, but without the innuendo of conspiracy or malpractice – it is there for anyone who is truly interested in finding the truth to see.

One important thing to notice is that the actual global trends are not affected in any way. The global mean change is listed as 0.43 degrees Celsius in both GHCN v2 and the modern GHCN v3.

Reto Ruedy, co author of the 1999 paper has described the advantages of GHCN v3 thus;
“For GHCN v3, NCDC developed a homogenization that is used to combine different station records for the same location as well as deal with discontinuities created by station moves, changes in instrumentation, the urban heat island effect etc. which eliminates many known and documented discontinuities still present in the unadjusted data and caused us to no longer use their unadjusted data.”
A grey area

Since Goddard's 'analysis' has been nothing but shoddy up to now we should not hold up much hope for any great revelation when he says;
"He (Hansen) also has created data in the southern hemisphere which didn’t previously exist. Note how the area of grey has shrunk."
Should we really expect that data has been 'created' or just that Mr. Goddard doesn't understand the difference in the data and would rather insinuate a grand conspiracy instead of actually finding out the truth of the matter? Sorry, but there are no prizes for picking such an obvious answer.

The change in grey area is a separate issue from not knowing the difference between GHCN v2 and GHCN v3. In 1999 NASA used the Reynolds and Smith ocean data which started in 1950, later they switched to the Hadley data since it went back to 1880 and covered a larger area. This explains the shrinking of the grey area. Again, this is not a secret only known by Hansen and a shadowy cabal of climate scientists. In Hansen's paper mentioned above, the one that the 1999 map came from, it clearly states in the Introduction;
"we also illustrate results for a global surface temperature index formed by combining our land analysis with sea surface temperature data of Reynolds and Smith [1994] and Smith et al. [1996]"


In Steve Goddard eyes, challenging him on any of this apparently makes you a “complete idiot” and “MentallyChallenged”. I wonder what, not knowing that you are comparing different data sets and then making ludicrous conspiracy type claims of malpractice, makes you? Other than someone misleading themselves and gullible others with shoddily researched pseudo-scientific nonsense that is.

Based on what I have found here, I strongly suspect that all of the posts Mr Goddard does about data being 'erased', 'created', inappropriately manipulated etc. are simply down to his ignorance about what data sets are used and the fact that he doesn't really care to find out because the truth might get in the way of his theories of conspiracy where he can make scientists like Dr. Hansen out to be some sort of bogey man.

I also strongly suspect that even if Goddard admits he didn't know that the maps were displaying different data, his published ignorance will go uncorrected, because we have seen that even his admitted errors are nor corrected at source.

There is some good news in all this. I noticed the problem with the scales immediately but when I went to comment, some others already had pointed out the same thing. Even one commenter who regularly posts supporting Goddard’s’ nonsense and often flames me stated “Actually the warmists are correct, the graphs show the same thing”, even if he went on to imply that the underlying data was garbage. But it is really heartening to see some others being truly sceptical about Goddard’s unqualified posts. I do not claim to have influenced this but there is hope that his readership is attracting more truly sceptical people, which can only be a good thing.

What Hansen et al got right decades ago.

Dr James Hansen gave a recent TED talk; ‘Why I must speak out about climate change’. Hansen like many scientists is not a natural orator. He comes across as quiet, dry and even shy and nervous, hiding under a hat and referring to his notes constantly.


Having said that, his talk is worth every minute it took to watch, he gives an overview of how he went from studying planets for NASA to Earth's climate, and why he has become an environmental activist. None of that however detracts from a good overview of his work, the science, and his concerns.

Early on in his talk he mentions a research paper published in Science from 1981; ‘Climate Impact of Increasing Atmospheric Carbon Dioxide’, J. Hansen, D. Johnson, A. Lacis, S. Lebedeff, P. Lee, D. Rind, G. Russell.

He says of the paper that he and his colleagues found that; “observed warming of 0.4 C in the prior century was consistent with the greenhouse effect of increasing CO2", and they also found, “that Earth would likely warm in the 1980s, and warming would exceed the noise level of random weather by the end of the century.”

I thought I’d take a closer look at the paper because it seems almost forgotten, with most deniers concentrating on Hansen in 1988, the year of his well-known Senate testimony, which included the three scenarios that deniers try to claim were hopelessly wrong predictions. They don't seem to know or want to know the difference between a scenario and a scientific prediction.

But having looked at this 1981 paper you realise that it must have formed a core part of his work that led him to being chosen to give testimony in front of the Senate. The whole paper seems uncanny in what it suggested the climate in the next few decades and into the 21st century would look like.

The first thing to notice is that there are a lot of caveats and even some statements that some could claim are contradictory. This isn’t fudge or hedge betting but an honest summary of the uncertainties that existed in the science over thirty years ago.

The paper states some beneficial effects of increased warming; “Beneficial effects of CO2 warming will include increased length of the growing season.” But with the caveats; “It is not obvious whether the world will be more or less able to feed its population. Major modifications of regional climate patterns will require efforts to readjust land use and crop characteristics and may cause large-scale human dislocations.”

All of which is either occurring or seems certain to. For example, “According to the Alaska ClimateResearch Center, Fairbanks is 2 1/2 degrees Fahrenheit warmer and 11 percent drier than it was 100 years ago. The changes have stretched the growing season from 85 days in the early 20th century to 123 days.”

 And on human dislocation; “Temporary migration as an adaptive response to climate stress is already apparent in many areas. But the picture is nuanced; the ability to migrate is a function of mobility and resources (both financial and social). In other words, the people most vulnerable to climate change are not necessarily the ones most likely to migrate.”

However in 1981 the net impact is still not determined and needed further study; “Improved global climate models, reconstructions of past climate, and detailed analyses are needed before one can predict whether the net long-term impact will be beneficial or detrimental.”

The papers states, “It is shown that the anthropogenic carbon dioxide warming should emerge from the noise level of natural climate variability by the end of the century, and there is a high probability of warming in the 1980’s.”

The IPCC, established in 1998, confirmed in its third assessment report in 2001 that ‘There is new and stronger evidence that most of the warming observed over the last 50 years is attributable to human activities’, and by the fourth, "warming of the climate system is unequivocal", and "most of the observed increase in global average temperatures since the mid-20th century is very likely due to the observed increase in anthropogenic greenhouse gas concentrations."

The team was also spot on about warming in the 80s and beyond. This was only a few years after the media frenzy in the 70s about a coming Ice Age and most people probably thought that was more likely even if the scientists knew better. For any climate deniers this must seem like a very lucky guess, but there is a reason why these people were picked to do research for NASA.

The paper also states; “Potential effects on climate in the 21st century include the creation of drought-prone regions in North America and central Asia as part of a shifting of climatic zones”. 

It still seems that these climatic zones are still in flux, but According to the U.S. Geological Survey, the current drought in the West of North America is the worst that has occurred in the last 500 years, with water flow levels at close to half those of the drought in the dirty thirties of the previous century, and  in Asia, the United Nations Development Programme has concerns about “The return of drought conditions to Central Asia" and "possible impact on food security” 

The paper states; “erosion of the West Antarctic ice sheet with a consequent worldwide rise in sea level,” confirmed in this paper from 2004;  

And sea level is on a rising trend;


Hansen et al, predicted the “opening of the fabled Northwest Passage.” This was a hell of a call at the time. “Floating polar sea ice responds rapidly to climate change. The 5° to 10°C warming expected at high northern latitudes for doubled CO2 should open the Northwest and Northeast passages along the borders of the American and Eurasian continents. Preliminary experiments with sea ice models suggest that all the sea ice may melt in summer, but part of it would refreeze in winter”.

To most people at the time this must have been seen as alarmist. Hansen states in his recent book 'Storms of My Grandchildren', (Which the video talk seems mostly lifted from), he believes he lost some funding in 1981 from the US Energy Department because this paper was considered too alarmist. Which flies in the face of 'skeptic' claims that scientists are being deliberately alarmist just to garner funding.

But the papers prediction is exactly what has happened, with that passage and it Eastern sister are now open at least part of the time in recent summers. At least one scheduled cruise liner (the MS Bremen in 2006) has successfully run the Northwest Passage.

Even more interesting due to recent research is the claim that “Even a partially ice-free Arctic will modify neighboring continental climates.”

If the most recent research about lack of ice causing a shift to the jet stream, and making colder winters is accepted – this is another accurate prediction.

This papers also states that “Climate models predict the larger sensitivity at high latitudes and trace it to snow/ice albedo feedback and greater atmospheric stability, which magnifies the warming of near-surface layers. Since these mechanisms will operate even with the expected rapidity of CO2 warming, it can be anticipated that average high-latitude warming will be a few times greater than the global mean effect”.

This is exactly what has been detected with the Arctic warming several times faster than average. 

And it has this to say on the worlds ice sheets; 
“Melting of the world’s ice sheets is another possible effect of CO2 warming. 

If they melted entirely, sea level would rise ~ 70 m. However, their natural response time is thousands of years, and it is not certain whether CO2 warming will cause the ice sheets to shrink or grow. 

For example, if the ocean warms but the air above the ice sheets remains below freezing, the effect could be increased snowfall, net ice sheet growth, and thus lowering of sea level.”

This is another good call because recent research and data from the Grace Satellites do show that over all ice sheets and glaciers are melting but in a few areas, such as the internal of Antarctica and the Himalayas there is increased snowfall and ice build up. 

But what of possible lowering of sea level? The paper gets it spot on again; “If the West Antarctic ice sheet melts on such a time scale, it will temporarily overwhelm any sea level change due to growth or decay of land-based ice sheets.”

Stunningly Hansen’s team states; “A 2°C global warming is exceeded in the 21st century in all the CO2 scenarios we considered, except no growth and coal phaseout.”

Over thirty years later, UN COPs discuss actions needed to try and keep temperature rise to under 2C, a temperature the paper suggests will cause 5C warming in Antarctica, but without much success so far and it seems that keeping future warming down to such a limit is becoming all but impossible and not without the end to massive coal burning.

In summary, Hansen et al;
  •  Was right about the 1980s warming, even though this was just after the media frenzy about a coming ice age.
  • Was right about erosion of ice sheets, rising sea levels and opening of the fabled Northwest Passage – a pretty good call.
  • Was right about warming at higher latitudes being greater than the global mean.
  • Was right about the increased growing season.
  • Was right about increased snow fall and net ice sheet growth – yet 'skeptics' today still use this as an argument against global warming.
  •  Was right about a partly ice free Arctic modifying neighbouring continental climates – if the most recent research about lack of ice causing a shift to the jet stream, and making colder winters is accepted – another good call.
  • Appears to be right about 2C warming being reached within a century and that temperature being the accepted limit before irreversible and detrimental effects occur.

There is nothing obviously incorrect in this paper.  All this was predicted using models that according to 'skeptics', are not supposed to work, over 30 years ago in 1981, the year IBM released it’s first PC with Microsoft MS DOS.

You have got to give this man and his team some credit for saying all this when most people thought we were still expecting an ice age. This is either good science or, if you reject AGW, they must have been very, very lucky. Personally I think I know why they were employed by NASA.

UPDATE
Coincidently in a post on April 2nd,  Real Climate have looked at one aspect of this paper and concluded that;
" a projection from 1981 for rising temperatures in a major science journal, at a time that the temperature rise was not yet obvious in the observations, has been found to agree well with the observations since then, underestimating the observed trend by about 30%, and easily beating naive predictions of no-change or a linear continuation of trends. It is also a nice example of a statement based on theory that could be falsified and up to now has withstood the test. The “global warming hypothesis” has been developed according to the principles of sound science."

Evaluating a 1981 temperature projection